Implementing Distributed Tracing with OpenTelemetry and Spring Boot 3
Understanding Distributed Tracing
Tracking is the most challenging part of microservices. Distributed tracing is the solution for that. It allows developers to monitor and visualize how requests flow through complex distributed systems.
What is OpenTelemetry?
OpenTelemetry is a vendor-neutral standard that provides metrics, logs, and traces across distributed applications. This helps comprehensive observability without being locked into a specific monitoring platform. OpenTelemetry also provides:
- Automatic and manual code instrumentation
- Compatibility with multiple backend systems
Setting Up a Spring Boot 3 Application with OpenTelemetry
We will configure OpenTelemetry for the Gradle application. Below are the changes I have made.
Project structure:
We’ll create two microservices:
- Order Service (Port 8084): Handles order operations and calls Price Service
- Price Service (Port 8083): Provides pricing information
opentelemetry-spring-boot/
├── order-service/
│   ├── src/
│   └── build.gradle
├── price-service/
│   ├── src/
│   └── build.gradle
├── build.gradle
├── settings.gradle
├── docker-compose.yml
└── otel-config.yml
Core Dependencies:
First, let’s understand the key dependencies we’re using:
dependencies {
    // Spring Boot core dependencies
    implementation 'org.springframework.boot:spring-boot-starter-web'
    implementation 'org.springframework.boot:spring-boot-starter-actuator'

    // OpenTelemetry core dependencies
    implementation 'io.micrometer:micrometer-registry-prometheus'
    implementation 'io.micrometer:micrometer-tracing-bridge-otel'
    implementation 'io.opentelemetry:opentelemetry-api'
    implementation 'io.opentelemetry:opentelemetry-sdk'
    implementation 'io.opentelemetry:opentelemetry-exporter-otlp'
    implementation 'io.opentelemetry.instrumentation:opentelemetry-instrumentation-api'
    implementation 'io.opentelemetry:opentelemetry-exporter-logging'
}
Key Dependencies Explained:
micrometer-tracing-bridge-otel: Bridges Micrometer tracing with OpenTelemetryopentelemetry-api: Core OpenTelemetry APIopentelemetry-sdk: Implementation of OpenTelemetry APIopentelemetry-exporter-otlp: Exports telemetry data using OTLP protocol
Service Implementation:
order service:
@RestController
@RequestMapping("/orders")
public class OrderController {
    private static final Logger LOGGER = LoggerFactory.getLogger(OrderController.class);
    private final PriceGateway priceGateway;

    @Autowired
    public OrderController(PriceGateway priceGateway) {
        this.priceGateway = priceGateway;
    }

    @GetMapping("/{id}")
    public Order findById(@PathVariable Long id) {
        // Log with trace context
        LOGGER.info("Processing order request for id: {}", id);

        // Call price service through gateway
        Price price = priceGateway.getPrice(id);

        // Create and return order
        return new Order(id, 1L, ZonedDateTime.now(), price.getAmount());
    }
}
Price Gateway(Important for Distributed Tracing):
@Component
public class PriceGateway {
    private final RestTemplate restTemplate;
    private static final Logger LOGGER = LoggerFactory.getLogger(PriceGateway.class);
    private static final String BASE_URL = "http://localhost:8083";

    @Autowired
    public PriceGateway(RestTemplate restTemplate) {
        this.restTemplate = restTemplate;
    }

    public Price getPrice(long productId) {
        LOGGER.info("Fetching price details for product: {}", productId);
        String url = String.format("%s/prices/%d", BASE_URL, productId);

        try {
            ResponseEntity<Price> response = restTemplate.getForEntity(url, Price.class);
            if (response.getStatusCode().is2xxSuccessful() && response.getBody() != null) {
                return response.getBody();
            }
            throw new RuntimeException("Failed to fetch price");
        } catch (Exception e) {
            LOGGER.error("Error fetching price: {}", e.getMessage());
            throw new RuntimeException("Price service communication failed", e);
        }
    }
}
RestTemplate Configuration(Critical for Trace Propagation):
@Configuration
public class RestTemplateConfig {

    @Bean
    public RestTemplate restTemplate() {
        return new RestTemplate();
    }
}
Price Service:
@RestController
@RequestMapping("/prices")
public class PriceController {
    private final static Logger LOGGER = LoggerFactory.getLogger(PriceController.class);

    @GetMapping("/{id}")
    public Price findById(@PathVariable Long id) {
        LOGGER.info("Retrieving price for product: {}", id);

        // Simulate some processing time
        try {
            Thread.sleep(100);
        } catch (InterruptedException e) {
            Thread.currentThread().interrupt();
        }

        return new Price(id, BigDecimal.valueOf(Math.random() * 100));
    }
}
OpenTelemetry Configuration
Application Properties
The properties file is crucial for proper OpenTelemetry setup:
# Service Configuration
spring.application.name=order-service
server.port=8084

# OpenTelemetry Core Configuration
otel.service.name=${spring.application.name}
otel.exporter.otlp.endpoint=http://localhost:4317
otel.traces.exporter=otlp
otel.metrics.exporter=otlp
otel.logs.exporter=otlp

# Sampling Configuration
management.tracing.sampling.probability=1.0

# Logging Pattern (includes trace and span IDs)
logging.pattern.level=%5p [${spring.application.name:},%X{traceId:-},%X{spanId:-}]

# Instrumentation Settings
otel.instrumentation.spring-webmvc.enabled=true
otel.instrumentation.spring-webflux.enabled=true
otel.resource.attributes=deployment.environment=development
OpenTelemetry Collector Configuration:
receivers:
  otlp:
    protocols:
      grpc:
        endpoint: 0.0.0.0:4317
      http:
        endpoint: 0.0.0.0:4318

processors:
  batch:
    timeout: 1s
    send_batch_size: 1024
  attributes:
    actions:
      - key: service.name
        action: upsert
        from_attribute: service.name

exporters:
  logging:
    loglevel: debug
  jaeger:
    endpoint: jaeger:14250
    tls:
      insecure: true

service:
  pipelines:
    traces:
      receivers: [otlp]
      processors: [batch, attributes]
      exporters: [logging, jaeger]
Docker Setup
Service Dockerfile:
FROM eclipse-temurin:17-jdk
WORKDIR /app
COPY build/libs/*.jar app.jar
EXPOSE 8081
ENTRYPOINT ["java","-jar","app.jar"]
Docker Compose Configuration:
version: '3.8'
services:
  order-service:
    build:
      context: ./order-service
      dockerfile: Dockerfile
    ports:
      - "8084:8084"
    environment:
      - SPRING_PROFILES_ACTIVE=docker
      - OTEL_EXPORTER_OTLP_ENDPOINT=http://otel-collector:4317
    networks:
      - otel-network

  price-service:
    build:
      context: ./price-service
      dockerfile: Dockerfile
    ports:
      - "8083:8083"
    environment:
      - SPRING_PROFILES_ACTIVE=docker
      - OTEL_EXPORTER_OTLP_ENDPOINT=http://otel-collector:4317
    networks:
      - otel-network

  otel-collector:
    image: otel/opentelemetry-collector:0.88.0
    volumes:
      - ./otel-config.yml:/etc/otel-collector-config.yml
    ports:
      - "4317:4317"   # OTLP gRPC
      - "4318:4318"   # OTLP HTTP
      - "8888:8888"   # Prometheus metrics
    networks:
      - otel-network

  jaeger:
    image: jaegertracing/all-in-one:1.47
    environment:
      - COLLECTOR_OTLP_ENABLED=true
    ports:
      - "16686:16686" # UI
      - "14250:14250" # Collector
    networks:
      - otel-network

networks:
  otel-network:
    driver: bridge
Now code changes are done. Let’s build the application.
Running and Testing
- Build the project:
./gradlew clean build2. Start the Docker containers:
docker-compose up --build3. Verify services are running:
docker psAfter you run this command you can see results like this:

4. Then you need to test the endpoint. For this, you can use the curl command or postman:
curl http://localhost:8080/product/1
curl http://localhost:8081/price/1
If an API call is breaking you can verify those using these commands:
# View Product Service logs
docker-compose logs -f product-service

# View Price Service logs
docker-compose logs -f price-service

# View OpenTelemetry Collector logs
docker-compose logs -f otel-collector

# View Jaeger logs
docker-compose logs -f jaeger
5. Access Jaeger UI:
- Open the browser and navigate to:
http://localhost:16686 - Select a service from the dropdown
- Click “Find Traces” to see the distributed traces
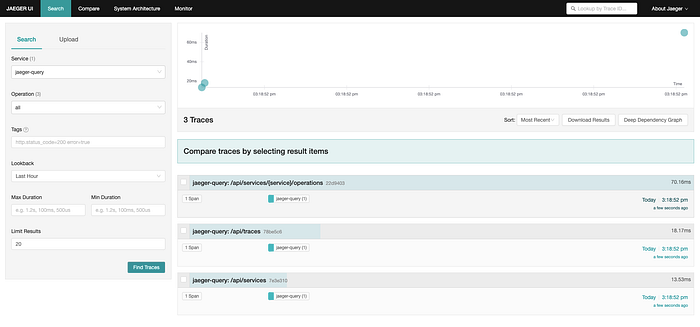
UI will look like this. We can trace the final API call to where it was made. This is the beauty of OpenTelemetry.
Troubleshooting
Common Issues and Solutions:
- No traces appearing in Jaeger:
- Verify OTLP endpoint configuration
- Check collector logs:
docker-compose logs otel-collector - Ensure sampling probability is set to 1.0
2. Services can’t communicate:
- Verify network configuration in docker-compose
- Check service ports and URLs
- Inspect service logs:
docker-compose logs service-name
3. Trace context not propagating:
- Ensure RestTemplate is properly configured
- Verify logging pattern includes trace IDs
- Check OpenTelemetry instrumentation settings
Best Practices
Sampling Strategy:
- Use 1.0 in development
- Adjust for production based on traffic
Logging:
- Always include trace and span IDs
- Use consistent log levels
- Add meaningful context to logs
Resource Attribution:
- Tag traces with environment
- Add service version
- Include deployment information
Error Handling:
- Properly propagate and log errors
- Include error context in traces
- Use appropriate HTTP status codes
Conclusion
Distributed tracing is a transformative approach for monitoring microservices and clarifying complex request flows. OpenTelemetry is a versatile, vendor-neutral solution that provides observability across distributed systems. By integrating OpenTelemetry into a Spring Boot 3 application, we can implement end-to-end tracing, which simplifies debugging and performance monitoring. With tools like Jaeger and OpenTelemetry Collector, developers can visualize traces and optimize microservices more effectively. This setup ensures a scalable and maintainable approach to observability, which is essential for modern applications.
Code without observability is like navigating in the dark. With OpenTelemetry, you’re not just coding — you’re building a system you can understand, debug, and improve. Happy coding, and may your traces be ever insightful! 🚀📊